
 NUMUS RESEARCH
What does it actually cost to get paid? The answer depends on the size of the payment, how the customer pays, what happens after the sale and which services are included.
This collection brings together 22 research findings, eight published fee facts and five reproducible cost examples. Each entry identifies its data period and scope. The 2026 label is the edition date; it does not turn older observations into 2026 data.
National estimates describe a market. Surveys describe their respondents. Our calculations show what happens under stated assumptions. None is a quote, an approval prediction or a benchmark for high-risk businesses.
The scale of U.S. payments
01U.S. core noncash payments reached 236.6 billion in 2024.
The size of the payments market is useful context, but it does not tell an individual merchant which processing setup will fit. Start with how your customers pay, your average sale and when you deliver the product or service.
Data / conditions: Calendar year 2024. Core noncash payments by consumers, businesses and governments.
Read this correctly: Cards, ACH and checks only; excludes wires and cash. Aggregate estimate, not a merchant-sales measure.
National Payment Volumes, Top-Line Data (CY 2015-24) ↗ · 2026-07-01
Table 1, Total row, 2024 Number; first key finding
02Cards represented 79% of U.S. core noncash payments by number in 2024.
Card acceptance addresses a large share of payment activity. This percentage describes the mix within a specific set of noncash payments; it cannot be used to claim that 79% of all purchases are made by card.
Data / conditions: Calendar year 2024. Core noncash payments by consumers, businesses and governments.
Read this correctly: Denominator excludes cash and wires; includes prepaid debit and private-label cards.
National Payment Volumes, Top-Line Data (CY 2015-24) ↗ · 2026-07-01
Third key finding; Table 1, Cards row
03U.S. credit card payments totaled 67.1 billion in 2024.
Keep credit and debit separate when describing the market. For your own business, a statement review can reveal the card mix behind your costs more clearly than a national total.
Data / conditions: Calendar year 2024. Credit card payments by consumers, businesses and governments.
Read this correctly: Includes general-purpose and private-label credit cards.
National Payment Volumes, Top-Line Data (CY 2015-24) ↗ · 2026-07-01
Table 1, Credit cards row
04U.S. debit card payments totaled 120.6 billion in 2024.
The debit category here is broader than a debit card tied to a checking account. That matters when comparing this estimate with another report that excludes prepaid cards or benefit payments.
Data / conditions: Calendar year 2024. Debit card payments by consumers, businesses and governments.
Read this correctly: Includes non-prepaid and prepaid debit, including EBT; not checking-account debit alone.
National Payment Volumes, Top-Line Data (CY 2015-24) ↗ · 2026-07-01
Table 1, Debit cards row
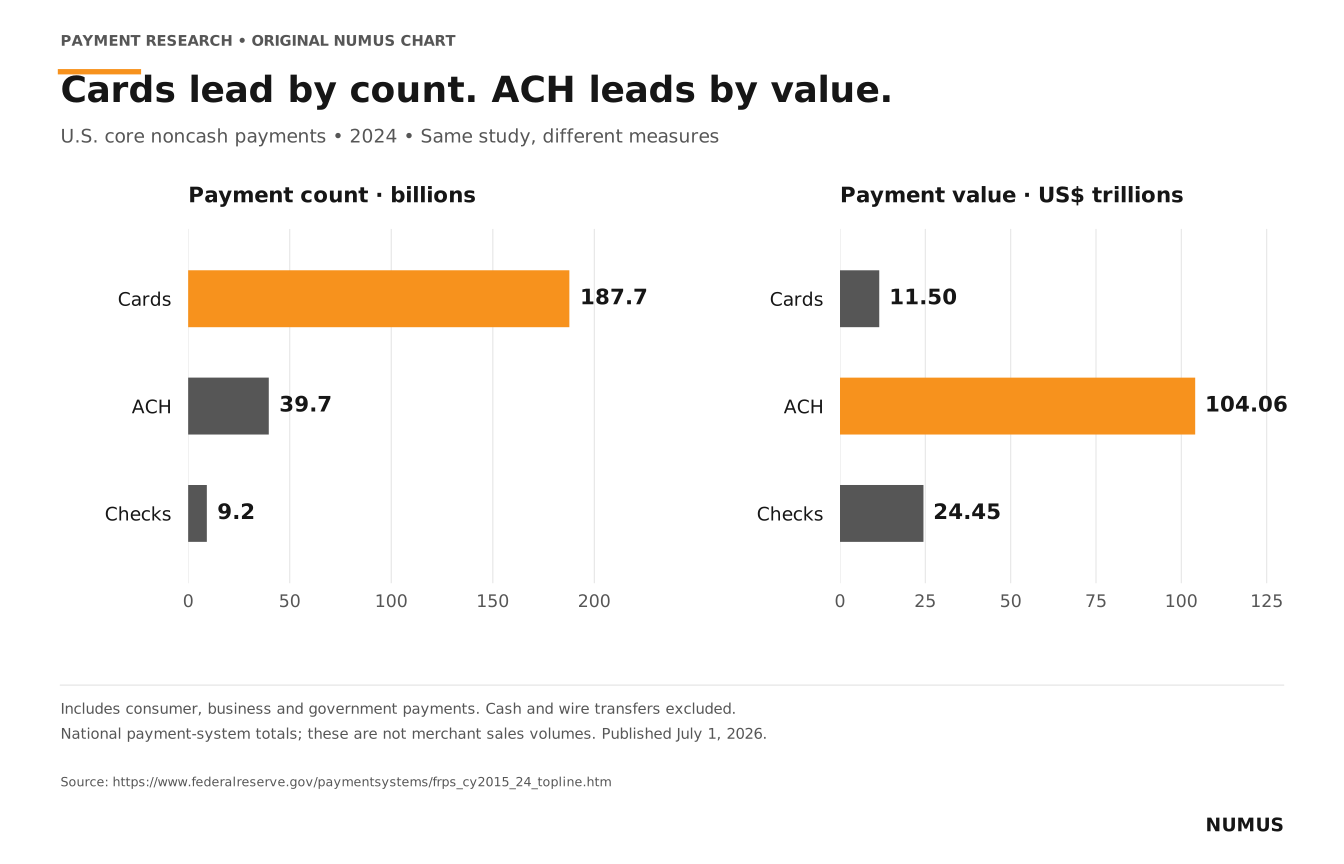
05U.S. ACH payments totaled $104.06 trillion in 2024, 74% of core noncash payment value.
ACH (Automated Clearing House) is a bank-payment network. Payment count and payment value tell different stories. A method can carry fewer transactions while moving more money. That is why the chart below keeps its two measures on separate axes.
Data / conditions: Calendar year 2024. ACH payments by consumers, businesses and governments.
Read this correctly: Includes network and on-us ACH; do not substitute Nacha network-only totals.
National Payment Volumes, Top-Line Data (CY 2015-24) ↗ · 2026-07-01
Table 1, Automated clearinghouse (ACH) row; ACH key finding
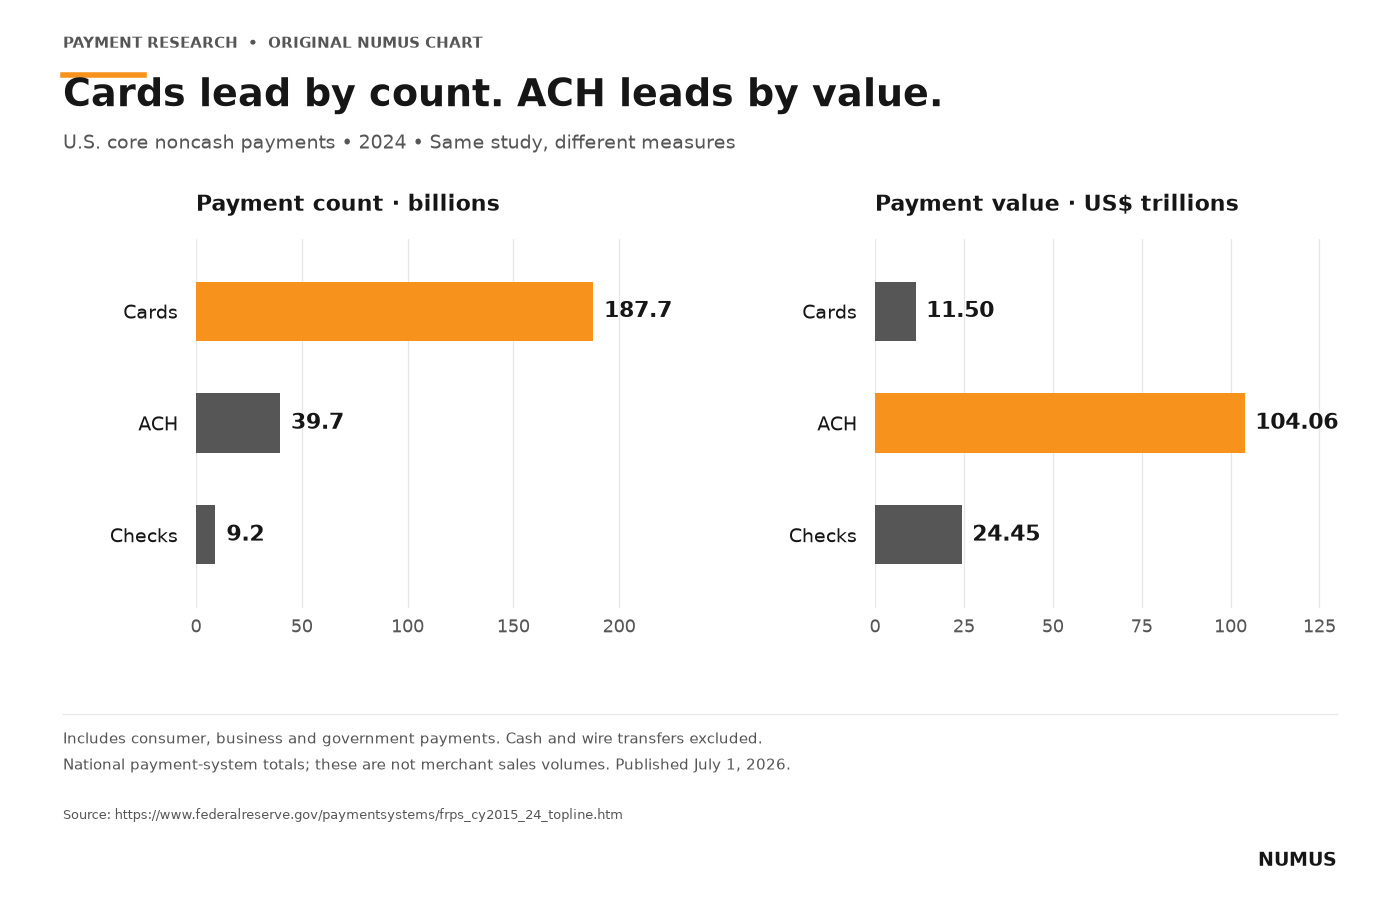
Different units emphasize that the payment rail leading by transaction count differs from the rail leading by value. Cash and wires are excluded; the figures are not merchant-sales volume.
06U.S. check payments numbered 9.2 billion in 2024, compared with 11.0 billion in 2021.
Checks remain part of business payment planning. A lower national count does not determine whether your particular customers will stop using them.
Data / conditions: Calendar year 2024; comparison 2021. Check payments by consumers, businesses and governments.
Read this correctly: Check payments differ from checks written, which also includes checks converted to ACH.
National Payment Volumes, Top-Line Data (CY 2015-24) ↗ · 2026-07-01
Table 1, Checks row
How consumers choose to pay
07U.S. consumers averaged 47.3 monthly payments in 2025, approximately 47 when rounded.
The consumer diary captures more than purchases at stores. Use it to understand payment habits, rather than to estimate the number of monthly orders your business should receive.
Data / conditions: October 2025; three-day diaries expressed as monthly averages. U.S. consumers; nationally weighted Diary, 6,079 participants.
Read this correctly: Survey estimate includes bills, purchases and P2P; small differences need not imply behavioral change.
2026 Findings from the Diary of Consumer Payment Choice ↗ · 2026-05-11
Printed page 5, Figure 1 discussion; page 23, reference 2
08Cash accounted for 14% of U.S. consumer payments by number in 2025.
An online-only merchant and a storefront will experience very different payment mixes. A national cash share should not become a target for either business without considering its customers and sales channels.
Data / conditions: October 2025. Payments by U.S. consumers; nationally weighted Diary, 6,079 participants.
Read this correctly: Consumer count share, not spending share or merchant sales.
2026 Findings from the Diary of Consumer Payment Choice ↗ · 2026-05-11
Printed page 3, key findings; page 23, reference 3
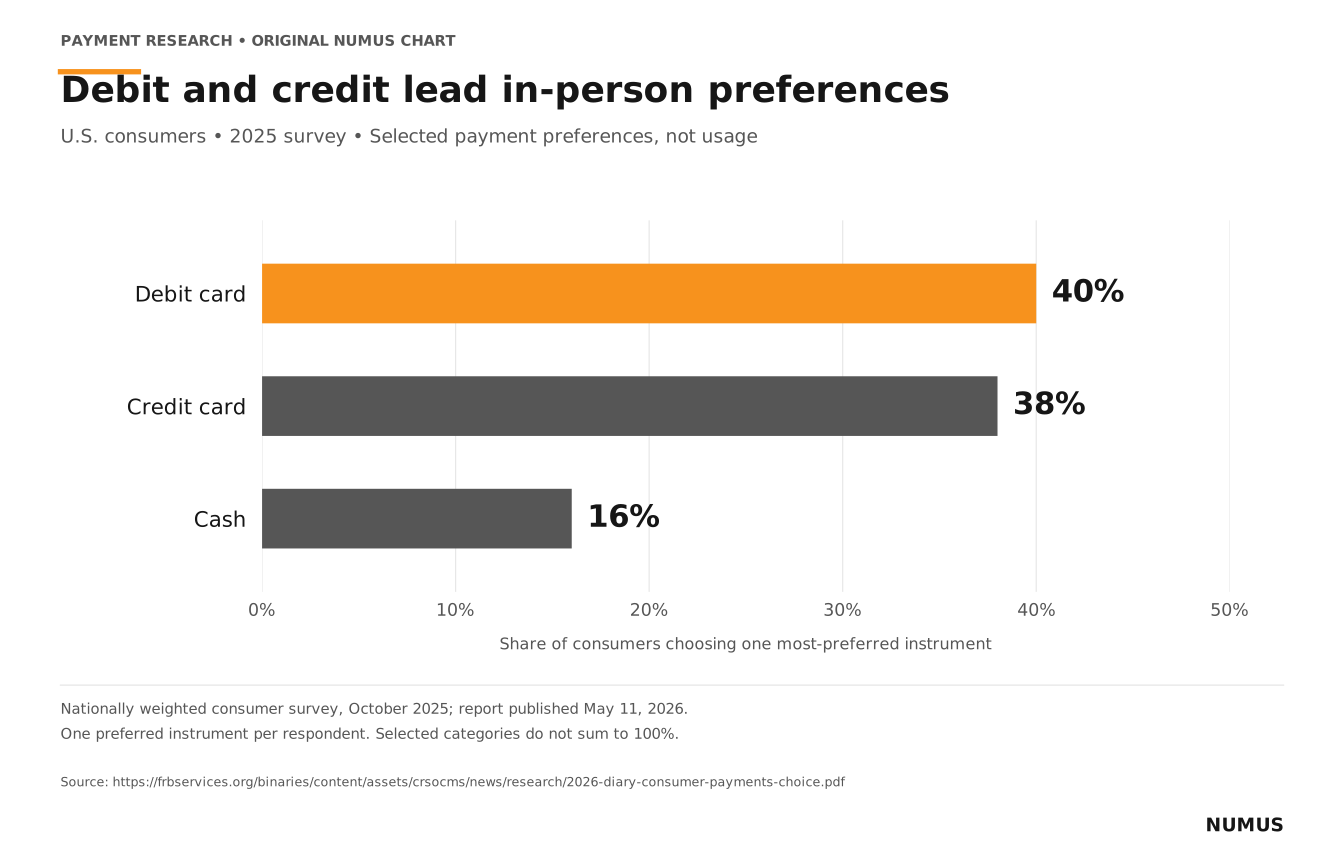
09For in-person payments in 2025, 40% of U.S. consumers preferred debit cards, 38% credit cards and 16% cash.
Preference and behavior are different measurements. A person who prefers a debit card may still use cash, credit or another method for particular purchases.
Data / conditions: October 2025 survey. U.S. consumers stating one preferred instrument for in-person payments.
Read this correctly: Stated preference is not actual usage. Three selected categories do not exhaust responses.
2026 Findings from the Diary of Consumer Payment Choice ↗ · 2026-05-11
Printed page 9, Figure 5 discussion; page 24, reference 10
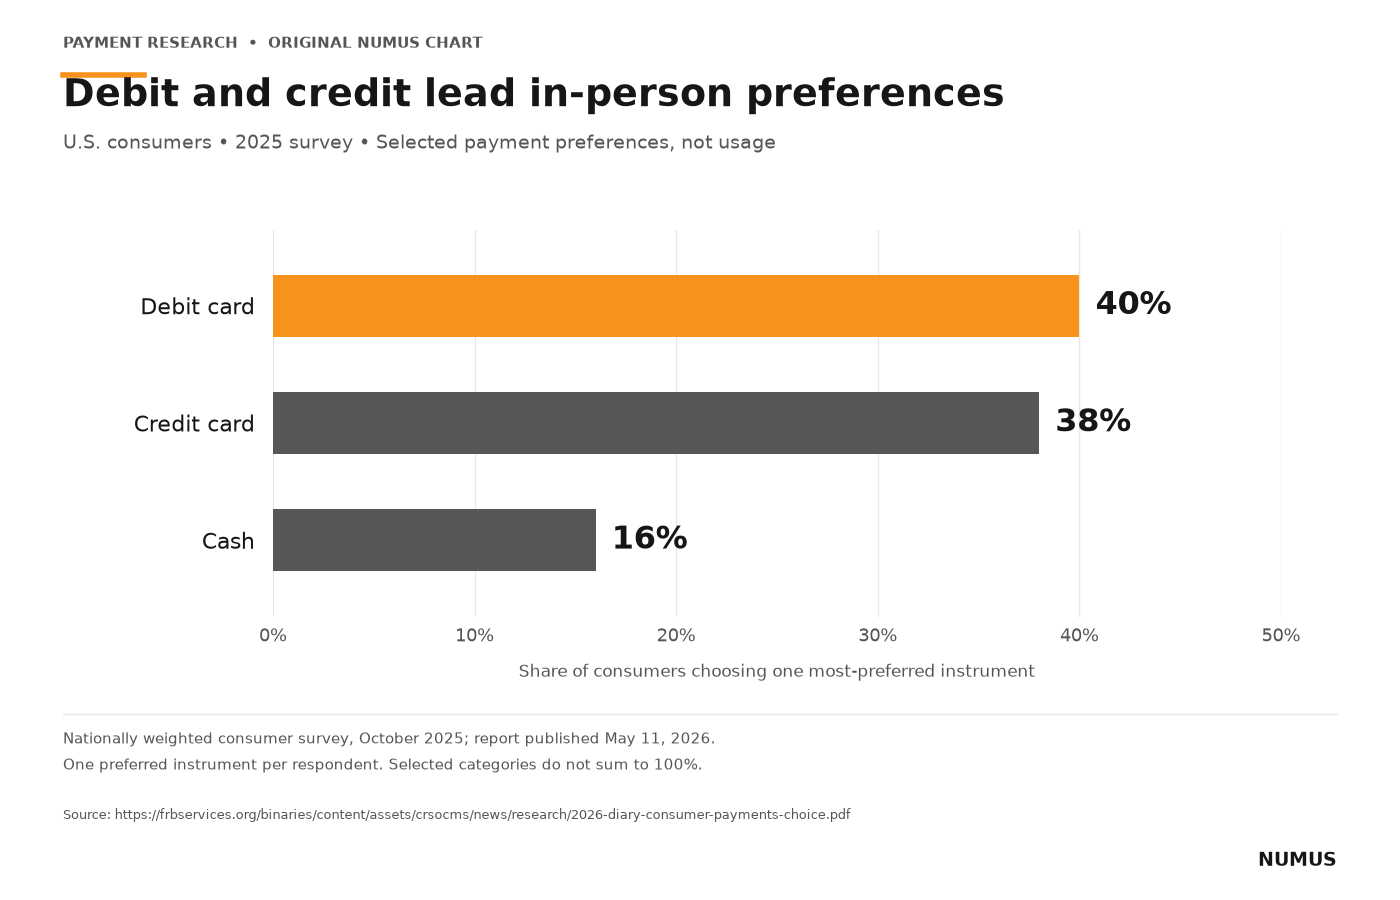
Original horizontal bar chart of three selected in-person preference categories in the 2026 Diary, which measures 2025 behavior and preferences.
10In 2025, 76% of U.S. consumers carried cash on at least one of their three Diary days.
Carrying cash does not mean spending it. This finding is useful for explaining why possession, preference and actual payment share should not be blended into one statistic.
Data / conditions: At least one day of an assigned three-day diary in October 2025. U.S. consumers; nationally weighted Diary, 6,079 participants.
Read this correctly: Cash possession, not spending, payment preference or daily-carry frequency.
2026 Findings from the Diary of Consumer Payment Choice ↗ · 2026-05-11
Printed page 13, Figure 9 and note
What small businesses report
11In the 2023 survey, 52% of small employer firms reported payment-processing fees as a challenge.
Processing fees are a practical concern for many surveyed firms. A useful cost review should show the dollars paid, the sales volume used as the denominator, and which services the total includes.
Data / conditions: Survey fielded September–November 2023. Weighted U.S. employer firms with 1–499 employees answering the optional payments challenge question; N=4,858.
Read this correctly: Weighted convenience sample; multiple responses permitted. Not a fee rate or all-business census.
2024 Report on Payments: Findings from the 2023 Small Business Credit Survey ↗ · 2024-12-05
Printed page 5, Payments-Related Challenges; N=4,858
12Slow-paying customers were a challenge for 39% of small employer firms in the 2023 survey.
Collecting revenue and minimizing acceptance costs are related but separate jobs. A lower advertised rate does not resolve an unpaid invoice or a mismatch between collection and delivery.
Data / conditions: Survey fielded September–November 2023. Weighted U.S. employer firms with 1–499 employees answering the optional payments challenge question; N=4,858.
Read this correctly: Reported concern, not the share of invoices paid late; convenience sample with multiple responses.
2024 Report on Payments: Findings from the 2023 Small Business Credit Survey ↗ · 2024-12-05
Printed page 5, Payments-Related Challenges; N=4,858
13Checks were accepted by 80% of small employer firms in the 2023 survey.
This is a measure of what firms accept, not what their customers actually use. Businesses can offer checks alongside cards and bank payments.
Data / conditions: Survey fielded September–November 2023. Weighted U.S. employer firms with 1–499 employees answering the optional payment-acceptance question; N=4,902.
Read this correctly: Acceptance does not measure transaction volume; firms could select several methods.
2024 Report on Payments: Findings from the 2023 Small Business Credit Survey ↗ · 2024-12-05
Printed page 1, Forms of Payment Accepted; N=4,902
14ACH was accepted by 56% of small employer firms in the 2023 survey.
Offering a payment method is only one part of evaluating it. Compare customer fit, collection timing, return exposure and the operational work involved.
Data / conditions: Survey fielded September–November 2023. Weighted U.S. employer firms with 1–499 employees answering the optional payment-acceptance question; N=4,902.
Read this correctly: Acceptance is not usage; optional-module results should retain their survey year and employer scope.
2024 Report on Payments: Findings from the 2023 Small Business Credit Survey ↗ · 2024-12-05
Printed page 1, Forms of Payment Accepted; N=4,902
Online retail in context
15U.S. retail e-commerce sales were estimated at $340.2 billion in Q2 2026.
Online retail is a substantial market, but this estimate is not a total for all internet commerce or card processing. It does not capture the whole universe of business-to-business payments or services.
Data / conditions: Q2 2026. U.S. retail employer firms; seasonally adjusted, not price adjusted; preliminary estimates. E-commerce describes how an order is placed, and payment need not occur online. It is not a measure of card-processing volume.
Read this correctly: Preliminary, seasonally adjusted estimate; not adjusted for price changes. Orders can qualify as e-commerce even when payment is made offline.
U.S. Census Bureau, Quarterly Retail E-Commerce Sales, Second Quarter 2026 ↗ · 2026-08-18
Release page 1; Table 1 adjusted row; underlying value $340,244 million.
16E-commerce represented 17.1% of U.S. retail sales in Q2 2026 on a seasonally adjusted basis.
The share helps place online retail in context. Keep the seasonally adjusted series consistent when comparing quarters, rather than mixing it with unadjusted figures.
Data / conditions: Q2 2026. U.S. retail employer firms; seasonally adjusted, not price adjusted; preliminary estimates. E-commerce describes how an order is placed, and payment need not occur online. It is not a measure of card-processing volume.
Read this correctly: Preliminary, seasonally adjusted estimate; not adjusted for price changes. Orders can qualify as e-commerce even when payment is made offline.
U.S. Census Bureau, Quarterly Retail E-Commerce Sales, Second Quarter 2026 ↗ · 2026-08-18
Release page 1; Table 1 adjusted row. Do not substitute the unadjusted 16.4% share.
Fraud and chargeback research
17Surveyed large U.S. merchants reported about $128 in handling costs per chargeback.
The $128 is our sum of two published components: $46 in third-party fees and $82 in internal costs. The survey covered 200 U.S. subscription and e-commerce merchant executives at businesses with at least $100 million in annual revenue. A chargeback can create work beyond returning a payment. For your own business, record fees and staff time separately from disputed principal; that prevents double-counting the loss.
Data / conditions: September 2025 survey. Subscription/ecommerce merchants with annual revenue of at least USD 100 million; United States.
Read this correctly: Excludes disputed transaction value/lost goods. Never add another study's transaction average or call this universal total loss. Large-merchant sample; not an SMB or sector-specific benchmark.
Chargebacks: The Case for Coordination ↗ · 2026-01
PDF page 4; Figure 12 on page 17
1879% of surveyed large U.S. merchants used outside chargeback-workflow support.
The same large-merchant study measured the use of third-party services or platforms for chargebacks and retrieval requests. Outside assistance can cover only part of the process. This result does not establish that outsourcing is necessary or cost-effective for every merchant.
Data / conditions: September 2025 survey. Subscription/ecommerce merchants with annual revenue of at least USD 100 million; United States.
Read this correctly: Includes partial assistance, not necessarily full outsourcing. Large-merchant sample; not an SMB or sector-specific benchmark.
Chargebacks: The Case for Coordination ↗ · 2026-01
PDF page 17
19Merchants in a four-country study classified about 45% of chargebacks as first- or third-party fraud.
Datos Insights interviewed 840 midsize and large merchants, equally divided among the United States, United Kingdom, Brazil and Australia. First-party fraud involves misuse by a customer; third-party fraud involves someone impersonating or using another person’s payment details. The source combines both categories. Labeling the entire number as friendly fraud would change the meaning of the source.
Data / conditions: Q4 2024 interviews. Midsize and large merchants; United States, United Kingdom, Brazil, Australia.
Read this correctly: Not 45% friendly fraud; not 45% of sales; classification is merchant-reported. Survey estimates, not Mastercard network transaction measurements; country-balanced sample is not a worldwide merchant census.
The chargeback window of opportunity ↗ · 2025-03
PDF pages 5, 12-13
2098% of respondents to a fraud survey reported at least one listed fraud type.
The fraud-question base was 576 respondents. The wider report surveyed 1,082 e-commerce payments and fraud professionals across 38 countries. Experiencing a fraud type is different from losing a particular percentage of revenue to it. The incidence figure should never be presented as a loss rate.
Data / conditions: October-November 2024 survey; retrospective preceding 12 months. eCommerce merchant payment/fraud professionals; 38 countries; North America, Europe, Asia-Pacific, Latin America.
Read this correctly: Incidence, not loss rate or fraudulent-order share. Survey edition year differs from fieldwork year; not transaction-weighted network data.
2025 Global eCommerce Payments & Fraud Report ↗ · 2025
PDF page 23, Figure 21
21Surveyed merchants reported rejecting an average 5.0% of orders for suspected fraud.
The 2025 report presents a trimmed average (with extreme values removed) of merchant-reported rates collected in October–November 2024. A rejection prompted by suspected fraud is not automatically a false decline. Measuring that tradeoff requires information about which rejected orders were legitimate.
Data / conditions: October-November 2024 survey; retrospective preceding 12 months. eCommerce merchant payment/fraud professionals; 38 countries; North America, Europe, Asia-Pacific, Latin America.
Read this correctly: Not payment declines generally; not confirmed fraud or false declines. Survey edition year differs from fieldwork year; not transaction-weighted network data.
2025 Global eCommerce Payments & Fraud Report ↗ · 2025
PDF page 25, Figure 24
22Surveyed merchants reported that an average 3.0% of accepted orders were later identified as fraudulent.
This is another trimmed average from the same report; it measures fraud identified after an order was accepted. This uses accepted orders as its denominator. Do not add it to the rejected-order percentage above or treat it as a card-network chargeback ratio.
Data / conditions: October-November 2024 survey; retrospective preceding 12 months. eCommerce merchant payment/fraud professionals; 38 countries; North America, Europe, Asia-Pacific, Latin America.
Read this correctly: Not chargeback ratio. Avoid prior-year comparison: prose and table disagree on the earlier value. Survey edition year differs from fieldwork year; not transaction-weighted network data.
2025 Global eCommerce Payments & Fraud Report ↗ · 2025
PDF page 25, Figure 24
Eight published fee facts
These eight facts are from one publicly documented provider schedule. They explain the inputs used below; they are not averages across processors.
23Stripe lists 2.9% + $0.30 for a successful U.S. domestic online card payment.
Stripe’s public U.S. standard price for a successful domestic online card payment provides a reproducible starting point for the examples below. It is one provider’s schedule, not a market average or a NUMUS quote. The fixed component matters more, as a percentage, on smaller purchases.
Data / conditions: Fee schedule checked September 19, 2026. Stripe U.S. published standard pricing; named product and conditions only.
Read this correctly: Provider terms can change. No NUMUS pricing, eligibility, partnership or savings claim is implied.
Stripe U.S. pricing ↗ · Checked 2026-09-19
Cards and wallets
24Stripe’s U.S. online-card schedule adds 1.5% for an international card.
Stripe lists the international-card charge as an addition to its domestic online-card rate. When evaluating a quote, identify which country determines the card classification and whether the quoted total includes that addition.
Data / conditions: Fee schedule checked September 19, 2026. Stripe U.S. published standard pricing; named product and conditions only.
Read this correctly: Provider terms can change. No NUMUS pricing, eligibility, partnership or savings claim is implied.
Stripe U.S. pricing ↗ · Checked 2026-09-19
Cards and wallets
25Stripe’s U.S. online-card schedule adds 1% when currency conversion is required.
Stripe’s currency-conversion addition is separate from its international-card addition. An international card does not always require currency conversion. The last cost example separates the two conditions.
Data / conditions: Fee schedule checked September 19, 2026. Stripe U.S. published standard pricing; named product and conditions only.
Read this correctly: Provider terms can change. No NUMUS pricing, eligibility, partnership or savings claim is implied.
Stripe U.S. pricing ↗ · Checked 2026-09-19
Cards and wallets
26Stripe Billing’s pay-as-you-go software price is 0.7% of Billing volume.
Stripe Billing lists a pay-as-you-go price of 0.7% of Billing volume. Payment processing is a different component. A complete comparison should specify whether recurring-billing software is included.
Data / conditions: Fee schedule checked September 19, 2026. Stripe U.S. published standard pricing; named product and conditions only.
Read this correctly: Provider terms can change. No NUMUS pricing, eligibility, partnership or savings claim is implied.
Stripe Billing pricing ↗ · Checked 2026-09-19
Pay as you go
27Stripe Billing volume can include externally processed transactions.
The Billing price description includes transactions processed outside Stripe. Moving payment processing alone therefore does not establish that this software charge disappears; the chosen billing arrangement matters.
Data / conditions: Fee schedule checked September 19, 2026. Stripe U.S. published standard pricing; named product and conditions only.
Read this correctly: Provider terms can change. No NUMUS pricing, eligibility, partnership or savings claim is implied.
Stripe Billing pricing ↗ · Checked 2026-09-19
Pay as you go
28One-off invoices are excluded from Stripe’s pay-as-you-go Billing volume.
The Billing page excludes one-off invoices from its stated Billing-volume calculation. That exclusion does not mean one-off invoices or their payments are free; separate invoicing and processing terms can apply.
Data / conditions: Fee schedule checked September 19, 2026. Stripe U.S. published standard pricing; named product and conditions only.
Read this correctly: Provider terms can change. No NUMUS pricing, eligibility, partnership or savings claim is implied.
Stripe Billing pricing ↗ · Checked 2026-09-19
Pay as you go
29Stripe does not return the original processing fee when a standard-pricing payment is refunded.
Stripe’s refund documentation says the original processing fee is not returned for standard pricing. In the full-refund example below, returned principal and the retained fee are tracked separately.
Data / conditions: Fee schedule checked September 19, 2026. Stripe U.S. published standard pricing; named product and conditions only.
Read this correctly: Provider terms can change. No NUMUS pricing, eligibility, partnership or savings claim is implied.
Stripe refund documentation ↗ · Checked 2026-09-19
Understanding fees for refunded payments
30Stripe adds no refund-issuance fee for a standard-pricing card refund.
Under Stripe’s documented standard pricing, issuing a card refund does not itself add a refund fee. That is compatible with retaining the original processing charge. Custom contracts and other payment methods require their own check.
Data / conditions: Fee schedule checked September 19, 2026. Stripe U.S. published standard pricing; named product and conditions only.
Read this correctly: Provider terms can change. No NUMUS pricing, eligibility, partnership or savings claim is implied.
Stripe refund documentation ↗ · Checked 2026-09-19
Understanding fees for refunded payments
Five worked cost examples
All five examples are original NUMUS calculations using hypothetical inputs. They are designed to be reproduced, not presented as observed merchant outcomes.
See how ticket size changes cost
Hypothetical successful charges only. Each charge’s fee is rounded to cents. Excludes refunds, cross-border additions, conversion and software. Default inputs use Stripe’s U.S. standard online-card schedule, checked September 19, 2026. This is not a NUMUS quote. Values stay in your browser.
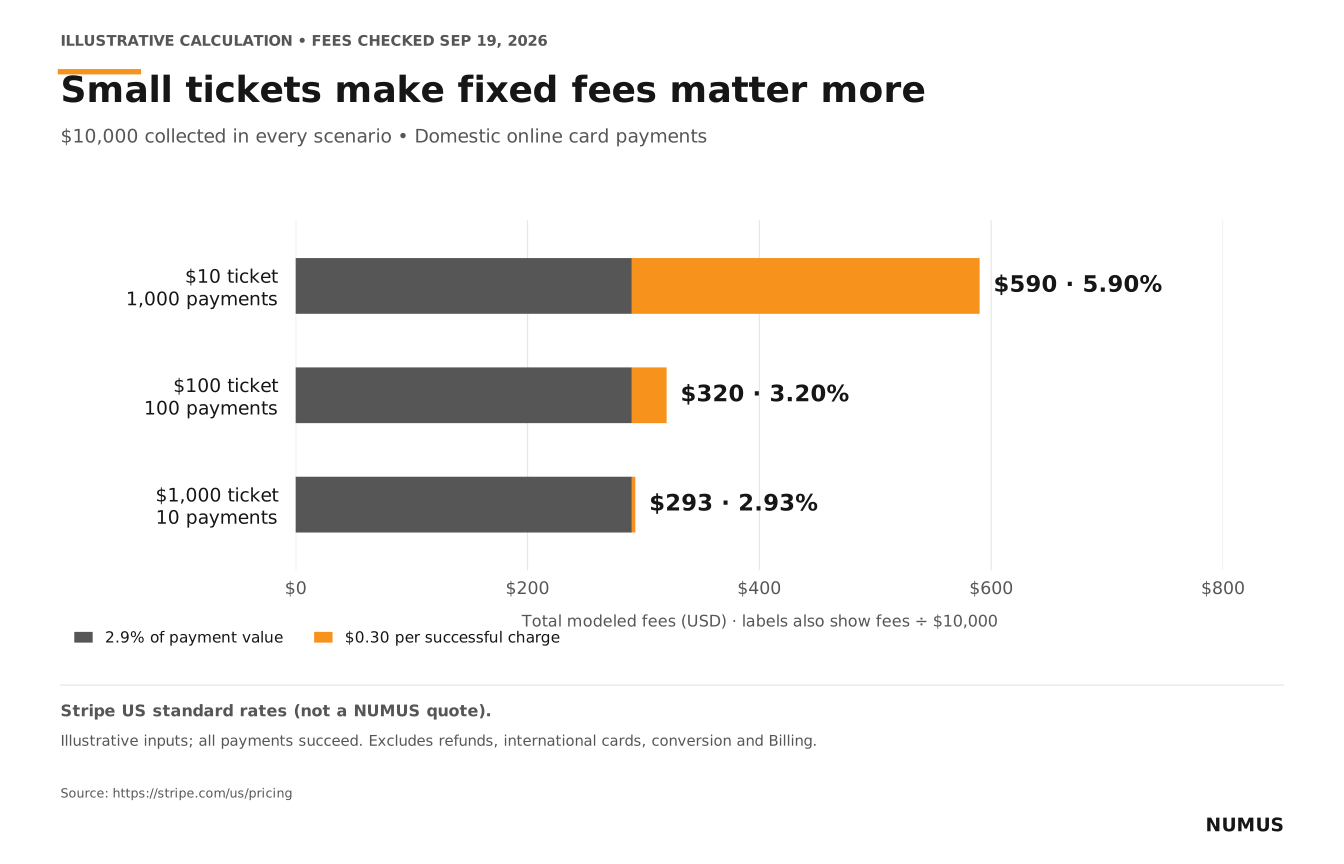
31Equal $10,000 sales volumes can produce $590, $320 or $293 in fees.
The percentage component is $290 in each case. Fixed charges add $300, $30 or $3. The effective rate is total modeled fees divided by the original gross sales volume. Changing the number of transactions changes cost even when gross sales stay equal.
| Scenario | Original sales | Modeled fees | Net after fees & refunds | Fees / sales after refunds |
|---|---|---|---|---|
| $10 ticket | $10,000.00 | $590.00 | $9,410.00 | 5.90% |
| $100 ticket | $10,000.00 | $320.00 | $9,680.00 | 3.20% |
| $1,000 ticket | $10,000.00 | $293.00 | $9,707.00 | 2.93% |
Data / conditions: Calculated September 19, 2026; hypothetical inputs. Illustrative U.S.-dollar examples, not observed merchant results.
Read this correctly: No refunds, international cards, currency conversion or billing software.
Published fee inputs: Stripe U.S. pricing ↗ · Calculated 2026-09-19
processing_fee = successful_charges × round_to_cent(ticket_usd × 0.029 + 0.30)
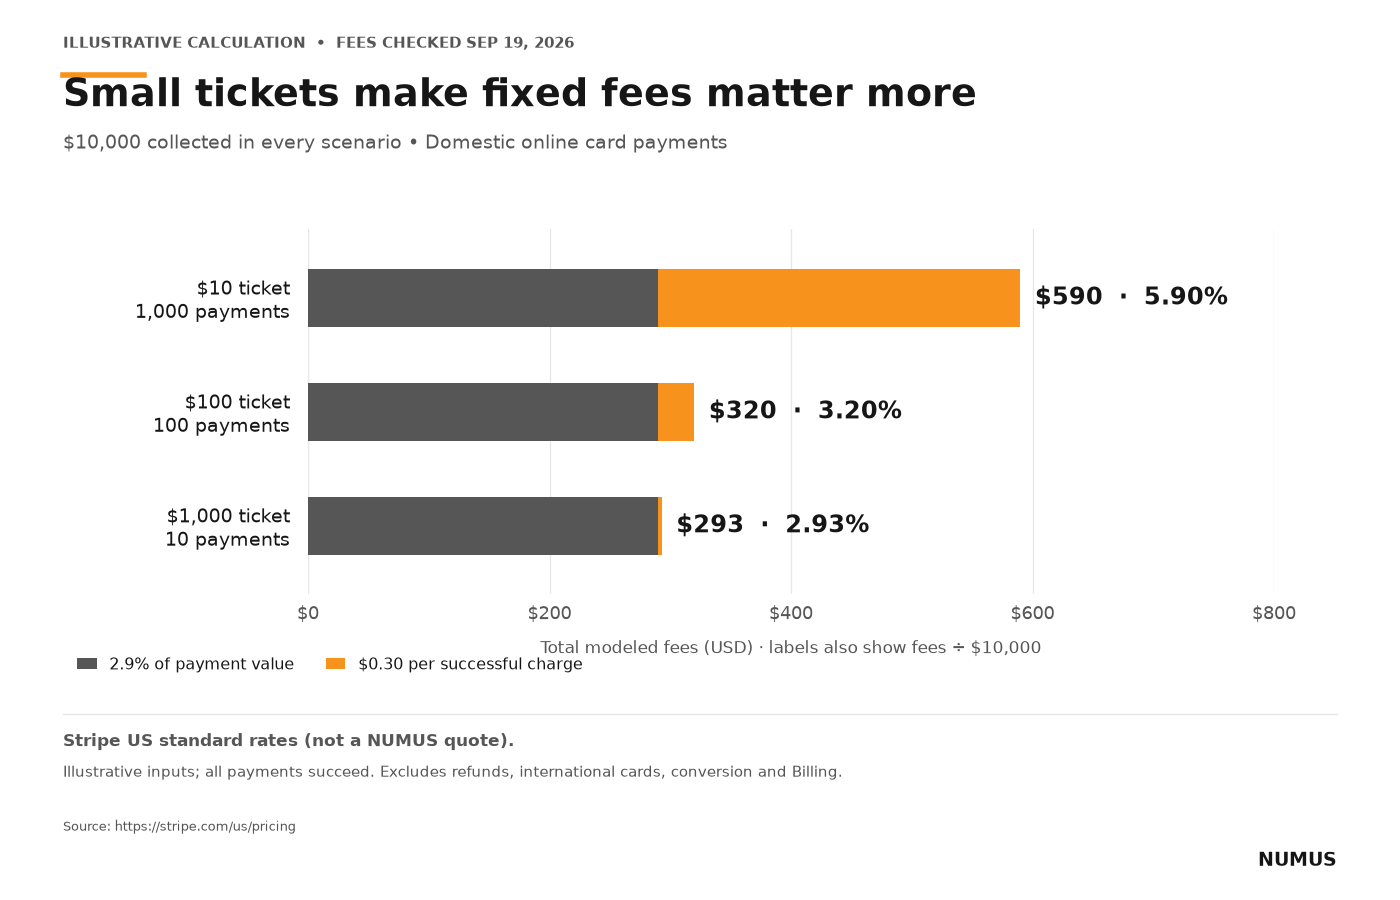
Illustrative model M1 separates the constant $290 percentage-fee component from fixed fees of $300, $30 and $3. Effective rates are 5.90%, 3.20% and 2.93%. Stripe US standard rates, not a NUMUS quote.
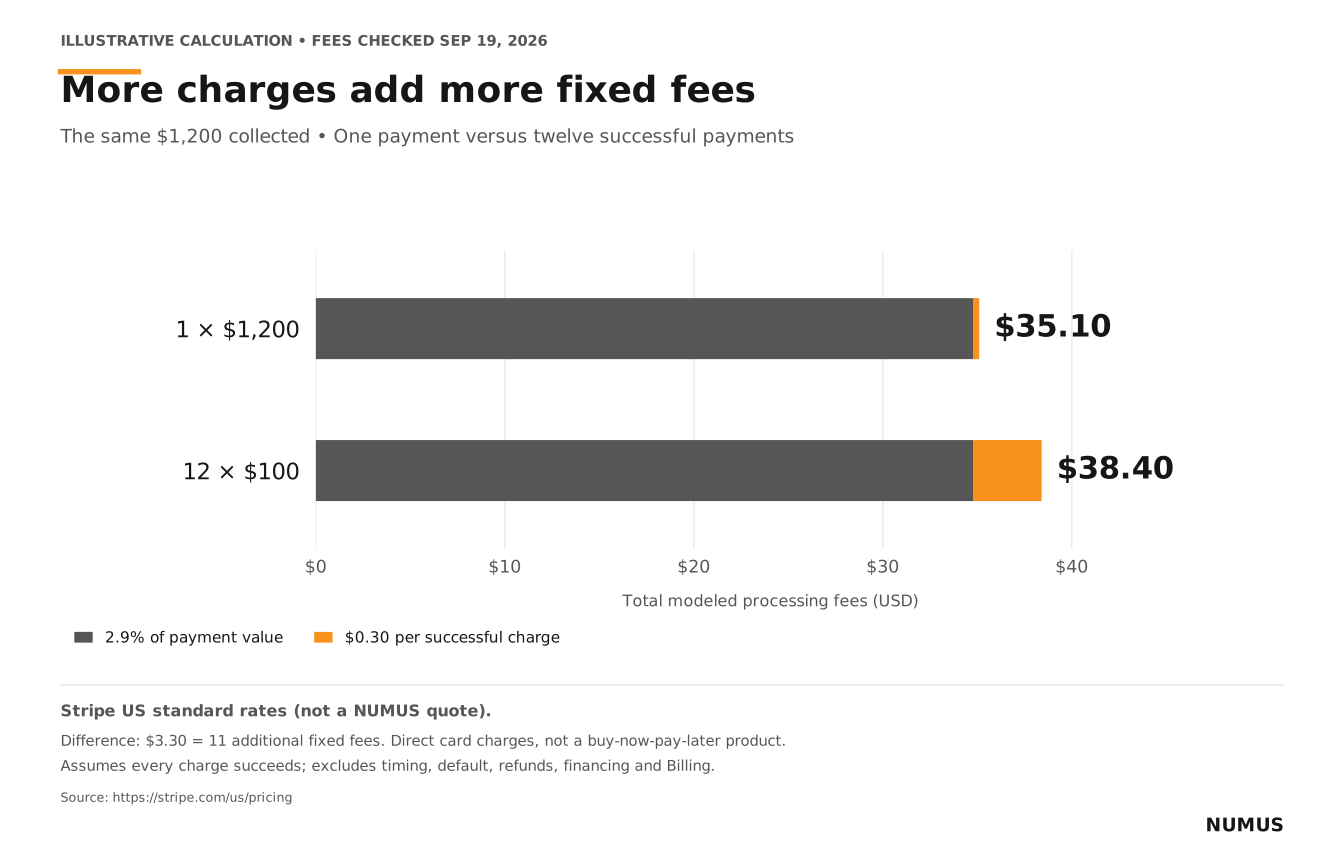
32Twelve $100 charges cost $3.30 more than one $1,200 charge in this model.
The eleven additional $0.30 fixed charges explain the entire $3.30 difference. These are twelve successful direct card payments, not a financing or buy-now-pay-later offer. The calculation does not tell us whether an installment option improves sales.
| Scenario | Original sales | Modeled fees | Net after fees & refunds | Fees / sales after refunds |
|---|---|---|---|---|
| One upfront charge | $1,200.00 | $35.10 | $1,164.90 | 2.93% |
| Twelve separate charges | $1,200.00 | $38.40 | $1,161.60 | 3.20% |
Data / conditions: Calculated September 19, 2026; hypothetical inputs. Illustrative U.S.-dollar examples, not observed merchant results.
Read this correctly: Direct card charges only, not a buy-now-pay-later product. Assumes all twelve payments succeed; no financing, timing, default, refunds or software fees.
Published fee inputs: Stripe U.S. pricing ↗ · Calculated 2026-09-19
upfront = round_to_cent(1200 × 0.029 + 0.30); split = 12 × round_to_cent(100 × 0.029 + 0.30); difference = (12 − 1) × 0.30
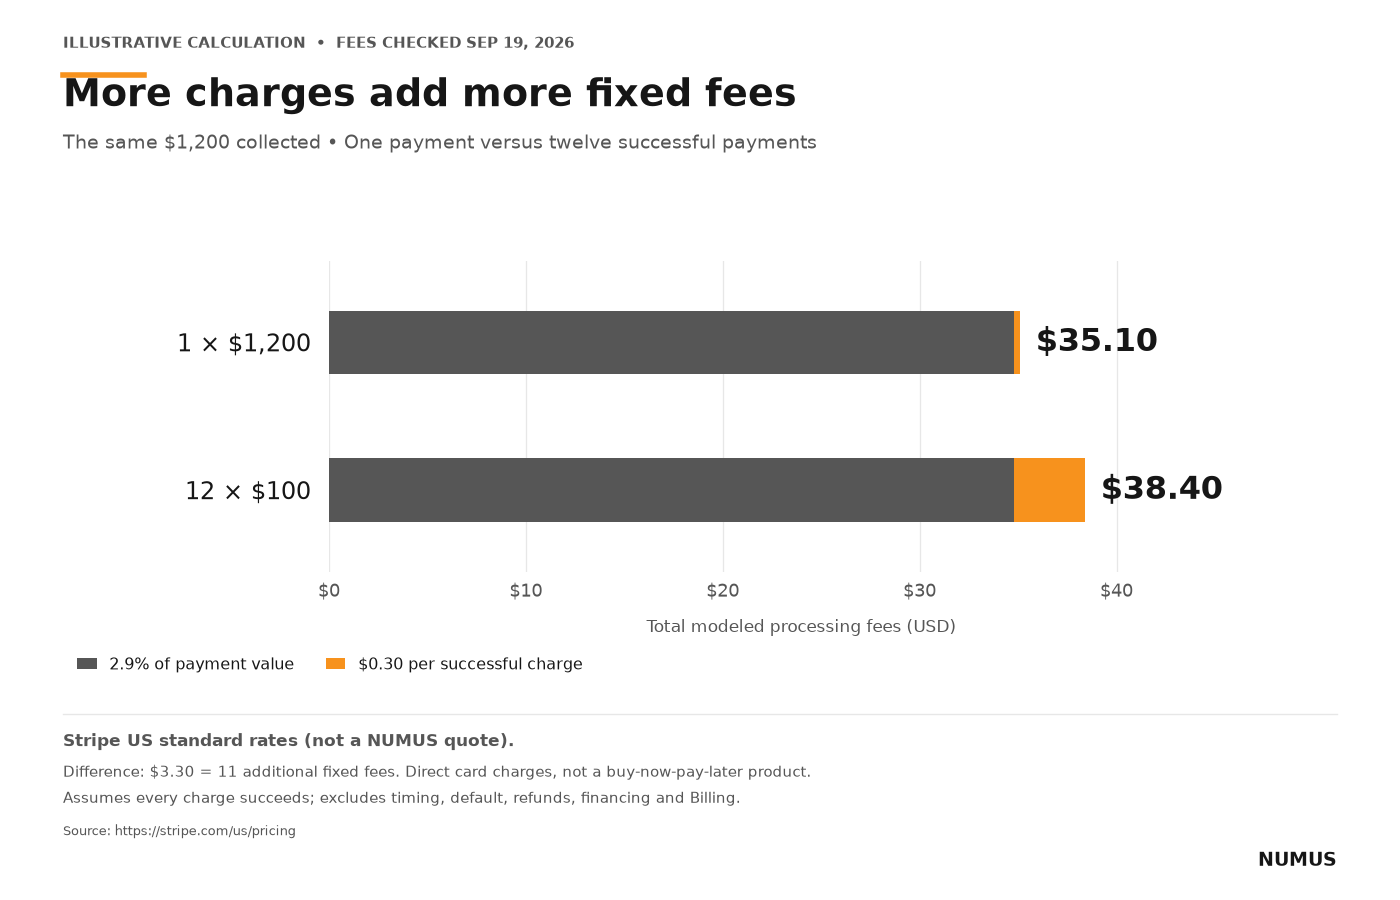
Illustrative model M2 holds gross volume and the 2.9% component constant, isolating the additional $0.30 fixed charges. This is not a financing or BNPL price comparison. Stripe US standard rates, not a NUMUS quote.
33In this model, a fully refunded $100 sale leaves a $3.20 processing cost.
The customer receives the full $100 principal back. The business retains no revenue from this sale and still bears the original $3.20 fee. Dividing by the original sale yields 3.20%; dividing by zero sales after the refund is undefined, not 0%.
| Scenario | Original sales | Modeled fees | Net after fees & refunds | Fees / sales after refunds |
|---|---|---|---|---|
| Sale before any refund | $100.00 | $3.20 | $96.80 | 3.20% |
| Same sale fully refunded | $100.00 | $3.20 | −$3.20 | Undefined (zero sales) |
Data / conditions: Calculated September 19, 2026; hypothetical inputs. Illustrative U.S.-dollar examples, not observed merchant results.
Read this correctly: Domestic standard card payment only; no additional fee to issue this modeled refund. The refunded $100 is returned principal, not an additional processing fee. Does not estimate product, service, fulfillment or tax costs.
Published fee inputs: Stripe U.S. pricing ↗ · Calculated 2026-09-19
fee = 100 × 0.029 + 0.30; net_cash = 100 − refunded_principal − 3.20; post_refund_rate = 3.20 ÷ (100 − refunded_principal) × 100, undefined when denominator is zero
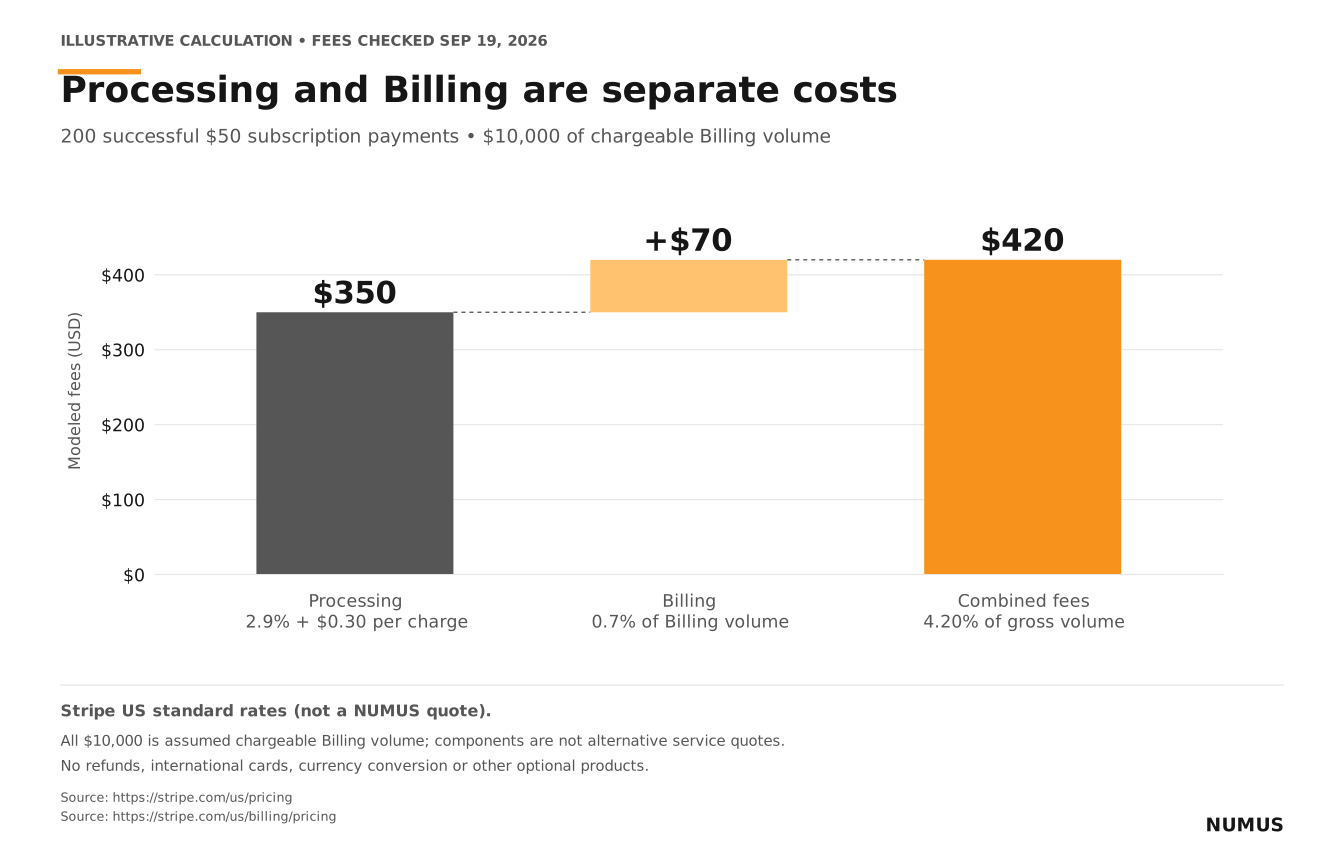
34A $10,000 subscription example totals $420 for processing plus billing software.
For 200 successful $50 payments, processing is $350. Billing software at 0.7% on the same stipulated $10,000 contributes another $70. The processing-only row isolates a component; it is not a complete competing subscription-service quote.
| Scenario | Original sales | Modeled fees | Net after fees & refunds | Fees / sales after refunds |
|---|---|---|---|---|
| Processing component only | $10,000.00 | $350.00 | $9,650.00 | 3.50% |
| Processing plus Billing | $10,000.00 | $420.00 | $9,580.00 | 4.20% |
Data / conditions: Calculated September 19, 2026; hypothetical inputs. Illustrative U.S.-dollar examples, not observed merchant results.
Read this correctly: The processing-only row isolates one fee component; it is not an alternative quote for a complete subscription service. Assumes all $10,000 is chargeable Billing volume; no free trials, credits, one-off invoices, refunds, international cards or conversion.
Published fee inputs: Stripe U.S. pricing ↗ · Calculated 2026-09-19
processing = 200 × round_to_cent(50 × 0.029 + 0.30); billing = 10000 × 0.007; combined = processing + billing
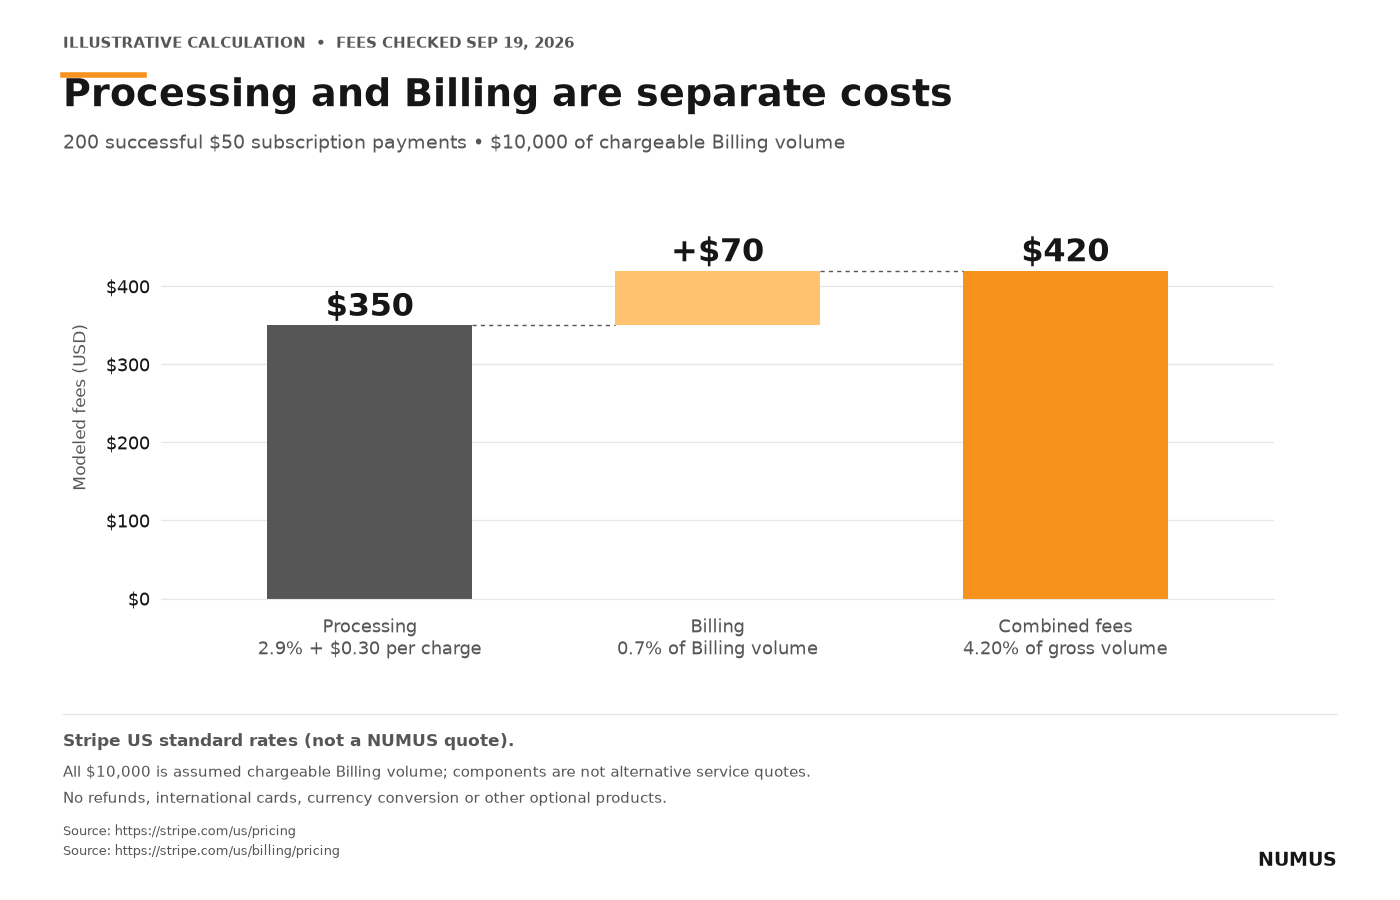
Illustrative model M4 adds domestic online card processing to pay-as-you-go Billing at 0.7% of assumed chargeable Billing volume. Components are not alternative complete-service quotes. Stripe US standard rates, not a NUMUS quote.
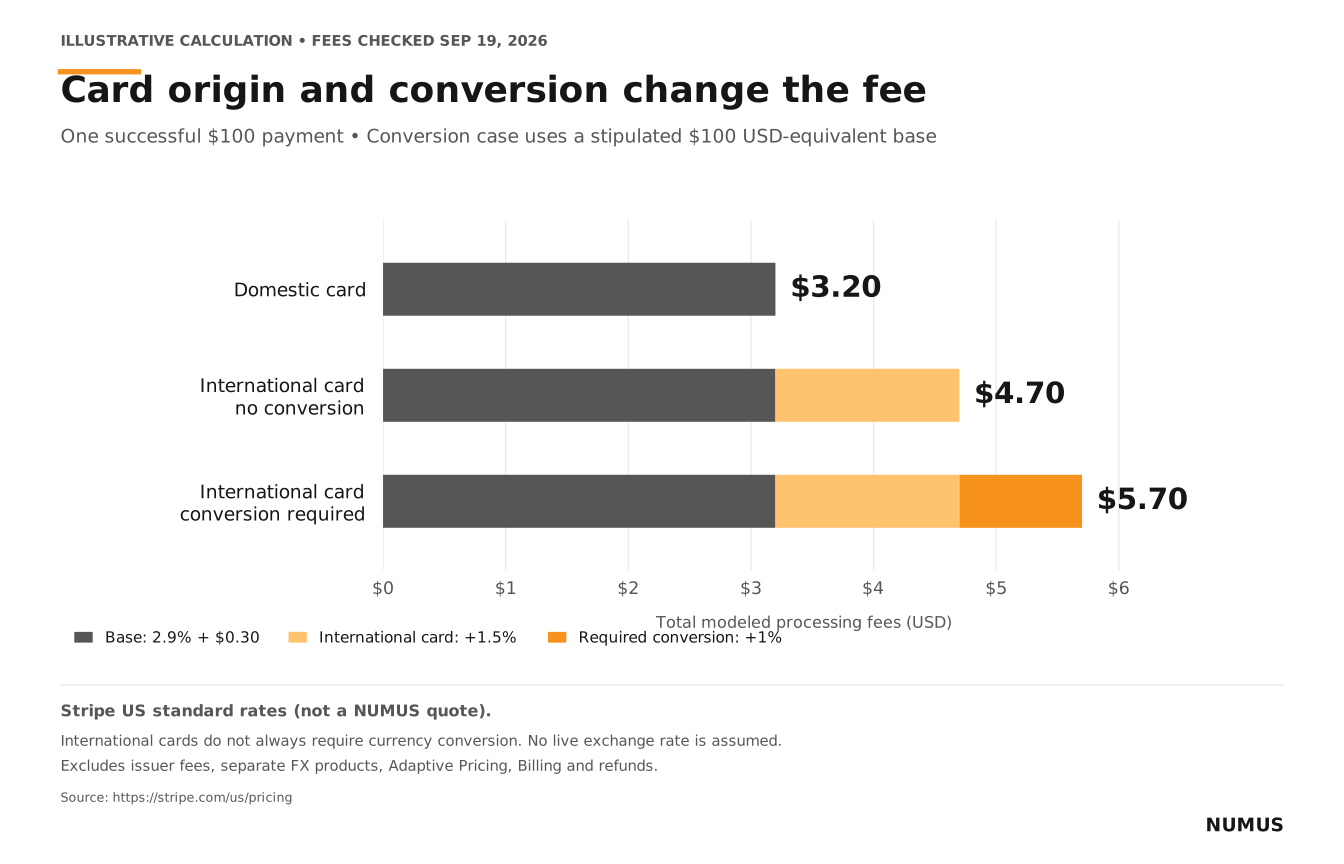
35A $100 payment models to $3.20, $4.70 or $5.70 depending on card and currency conditions.
The international-card addition is $1.50 on the stipulated $100 fee base. If conversion is also required, the modeled addition is another $1.00. The conversion example uses a fixed $100 U.S.-dollar-equivalent base, not a live exchange-rate calculation.
| Scenario | Original sales | Modeled fees | Net after fees & refunds | Fees / sales after refunds |
|---|---|---|---|---|
| Domestic card | $100.00 | $3.20 | $96.80 | 3.20% |
| International; no conversion | $100.00 | $4.70 | $95.30 | 4.70% |
| International; conversion required | $100.00 | $5.70 | $94.30 | 5.70% |
Data / conditions: Calculated September 19, 2026; hypothetical inputs. Illustrative U.S.-dollar examples, not observed merchant results.
Read this correctly: Currency conversion is a separate condition; an international card does not itself imply conversion. The conversion case stipulates a $100 USD-equivalent fee base; no live exchange rate is assumed. Excludes Adaptive Pricing, separate FX products, issuer fees, Billing and refunds.
Published fee inputs: Stripe U.S. pricing ↗ · Calculated 2026-09-19
fee = 100 × (0.029 + international_addon_rate + currency_conversion_addon_rate) + 0.30
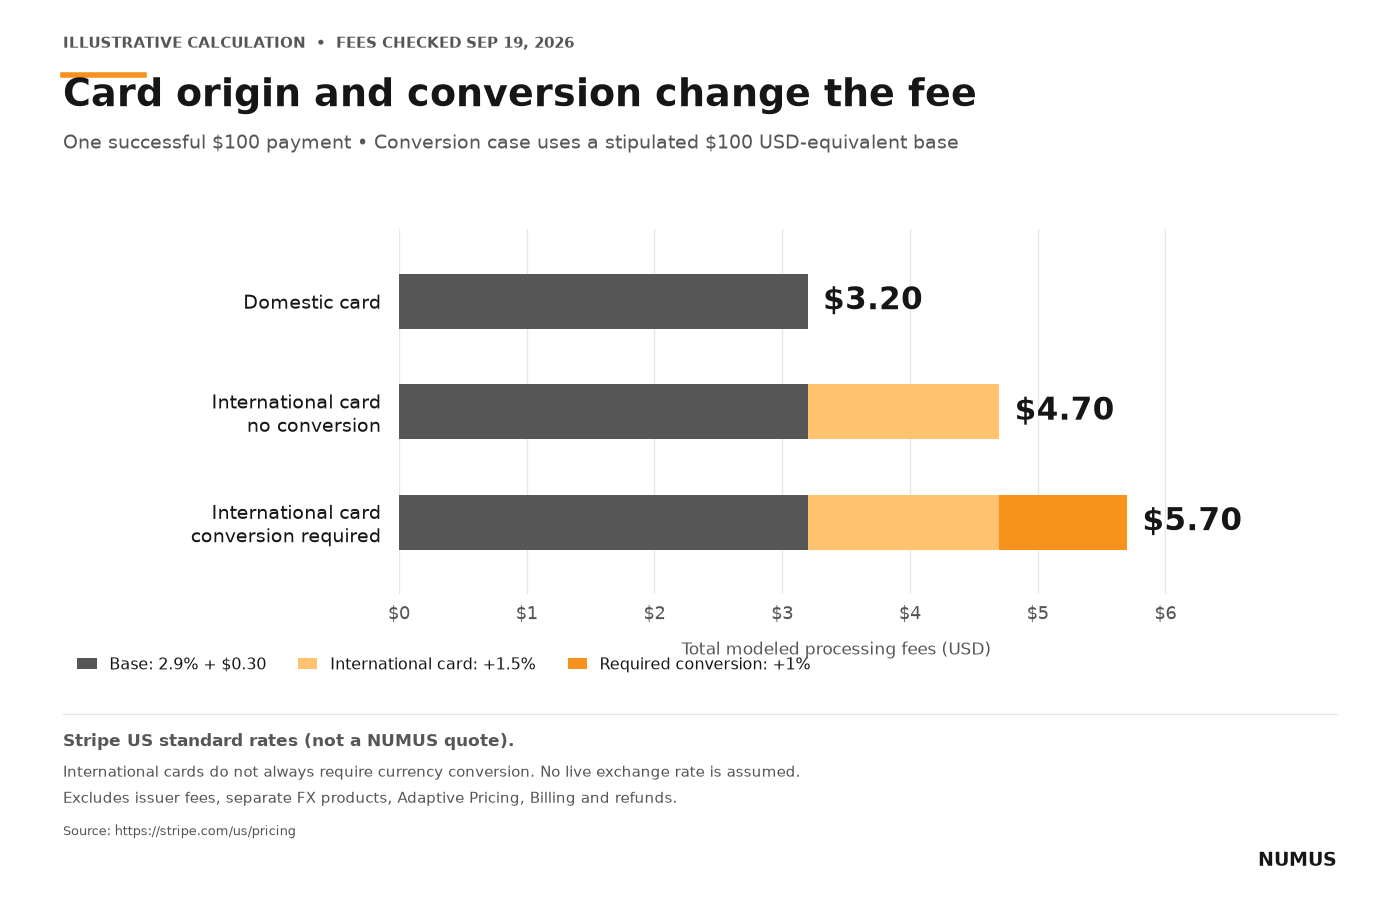
Illustrative model M5 keeps card origin separate from the need for currency conversion. The conversion example stipulates a $100 USD-equivalent fee base and assumes no live exchange rate. Stripe US standard rates, not a NUMUS quote.
Dates, denominators and reproducible math
- Research cutoff: September 19, 2026. We selected original government releases, original research reports and official provider documentation. Inclusion is based on relevance and traceability, not a complete census of payments research.
- Edition versus observation: Federal Reserve market totals refer to 2024. The 2026 consumer Diary describes October 2025. The small-business report uses 2023 survey responses. Other studies retain their own fieldwork periods beside each finding.
- Do not pool these populations: Consumers, employer firms and large e-commerce merchants are different samples. Survey averages are not transaction-weighted national totals. These sources do not establish a processing-cost or fraud benchmark for coaching, supplements or other higher-risk industries.
- Survey limitations: The small-business results use a weighted convenience sample and optional questions. Commercial fraud studies rely on self-reporting. The large-merchant Javelin study was sponsored by Mastercard; the fraud report comes from Visa Acceptance Solutions, Verifi and the Merchant Risk Council.
- Cost method: The five examples use hypothetical transaction counts and ticket sizes. Processing fee per charge = amount × applicable percentage + fixed fee, rounded to cents. Multiply by successful charges; add separately specified software fees. Every scenario and input is downloadable.
- Effective rate: Fees divided by the stated sales denominator. Original sales and sales after refunds are distinct denominators; the workbook exposes both. A zero denominator produces “undefined,” never a zero effective rate.
- Named providers: Stripe is used because its public fee inputs make the math reproducible. This is not an endorsement, an offer, an eligibility comparison or evidence of a NUMUS partnership. Negotiated contracts may differ.
- Corrections: Send the specific entry and supporting source to support@nms.io. Updates should preserve the original data periods and record what changed.
Use the numbers. Check the work.
The workbook, source ledger and original charts are available without an email gate. When citing a published statistic, retain its population and data year and link to the original source.
Editable cost workbook
Five models, 12 scenarios, visible inputs and formulas. Change the inputs to explore the arithmetic.
Download XLSXSources and calculation data
All 35 entries with source URLs, dates, limits and page references, plus the worked scenario data.
Source ledger CSVCost examples CSV
NUMUS-created charts and model explanations may be reused with attribution to NUMUS and the underlying sources. Third-party source material remains subject to its own terms.
Turn the findings into a better processing decision
A useful comparison starts with your actual sales pattern. Gather a recent statement, transaction count, average ticket, refund experience and recurring-billing requirements. Then compare the full set of costs and operating conditions.